
Home
Case Studies Process FAQ

Home / Case Studies / Jewelry & Accessories / E-commerce

Jewelry & Accessories / E-commerce February – July 2026 · 6 months

Four Flat Months, Then a Step Change That Held

Six months of SEO work on an online jewelry and accessories brand, closing the period at 170K impressions, 3.49K organic clicks and an average position of 9.

search.google.com/search-console/performance
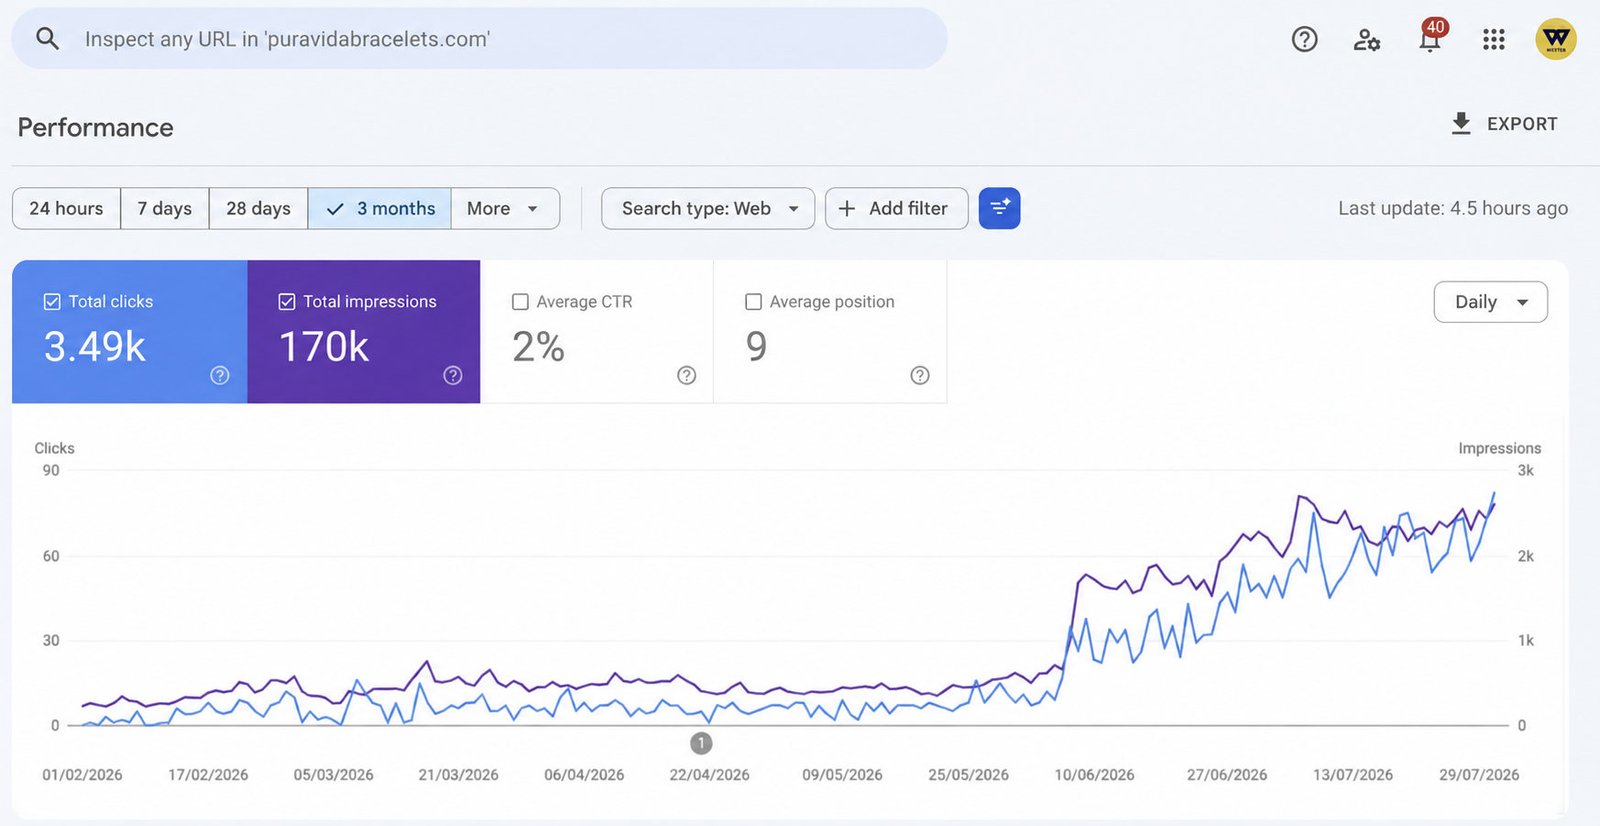
Google Search Console performance report for an online jewelry and accessories store, showing 3.49K clicks and 170K impressions with a step change in early June followed by continued growth through July

Google Search Console, Performance report. The date range is the one shown on the chart.

3.49K organic clicks
170K impressions
2% average CTR
9 average position
Reading the Curve

A Low, Steady Line Until 10 June

Clicks and impressions hold a flat line from February through May. Around 10 June both step up sharply, and the climb continues to the end of July.

Start of engagement Final days

An illustration of the shape visible in the Search Console screenshot above. It is not a separate dataset and carries no figures of its own.

The Story

What We Found, What We Did, What Happened

01

The Challenge

The website had relatively low and steady organic search activity through the first several months of the tracked period, at around 10 clicks a day off roughly 450 daily impressions. The challenge was to increase search visibility and generate more consistent organic traffic for the brand’s products and related content.

02

Our Strategy

The campaign focused on improving organic visibility through keyword optimisation, on-page SEO, content improvements, internal linking, and ongoing Google Search Console monitoring. The work was aimed at helping relevant product and content pages gain stronger positions in Google Search.

03

The Result

Search Console recorded 3.49K clicks and 170K impressions across the six months, at a 2% average CTR and an average position of 9. The graph shows a clear change from around 10 June onward, with both clicks and impressions rising substantially. By late July daily clicks were reaching roughly 80, and daily impressions close to 2.7K.

Where This Work Sits

The Services Behind This Engagement

The work here was keyword optimisation, on-page SEO and internal linking across product and content pages, watched week by week in Search Console.

Want a Curve Like This on Your Own Site?

Send us your domain. Within two business days you will get an honest read on where your visibility is being lost, ranked by what it is costing you, and how long a change would realistically take.

Response within two business days. No contracts, no obligation.