
Home
Case Studies Process FAQ

Home / Case Studies / SaaS / Time Tracking & Productivity

SaaS / Time Tracking & Productivity May – August 2026 · 3 months

From Modest Search Activity to 240K Clicks in Three Months

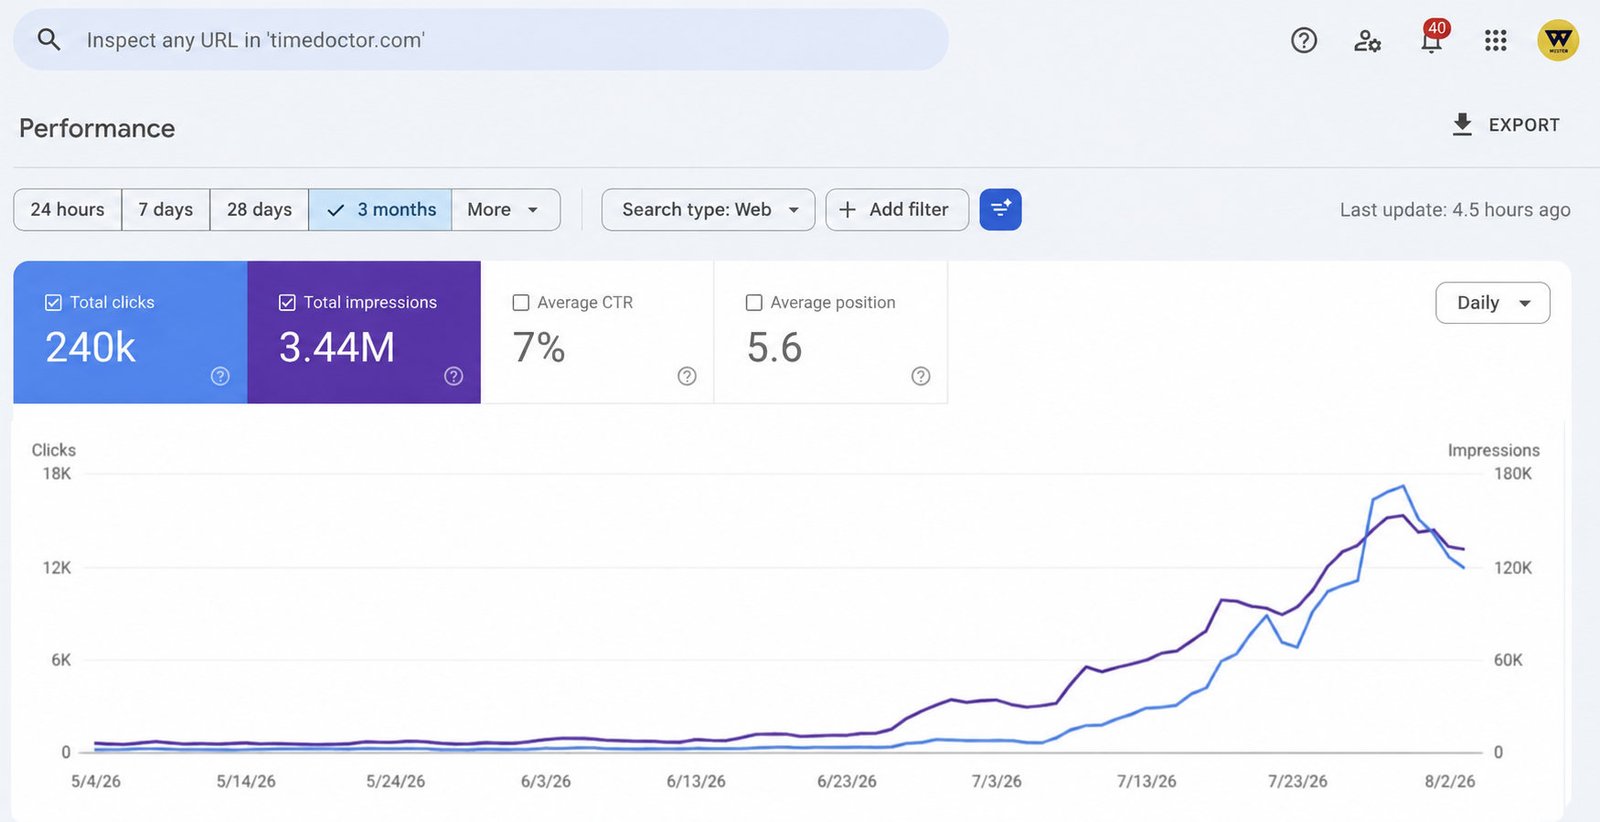
Three months of SEO work on a global time-tracking and productivity platform, closing the period at 3.44M impressions, 240K organic clicks and an average position of 5.6.

search.google.com/search-console/performance
Google Search Console performance report for a time-tracking and productivity SaaS platform, showing 240K clicks and 3.44M impressions with both curves flat until late June and then climbing steeply through July

Google Search Console, Performance report. The date range is the one shown on the chart.

240K organic clicks
3.44M impressions
7% average CTR
5.6 average position
Reading the Curve

A Flat Line Until Late June, Then a Steep Climb

Nothing much moves for the first seven weeks. From late June the line lifts sharply and keeps rising through July, with the strongest days landing in the final fortnight.

Start of engagement Final days

An illustration of the shape visible in the Search Console screenshot above. It is not a separate dataset and carries no figures of its own.

The Story

What We Found, What We Did, What Happened

01

The Challenge

The website had a relatively modest level of organic search activity at the start of the reporting period. The first seven weeks ran at a few hundred clicks a day. The opportunity was to expand search visibility and generate more qualified organic traffic for its productivity and time-tracking content.

02

Our Strategy

The campaign focused on improving organic visibility through keyword and content optimisation, on-page SEO, internal linking, and ongoing Google Search Console monitoring. The work went into strengthening relevant pages and improving their ability to appear for valuable search queries.

03

The Result

Search Console recorded 240K clicks and 3.44M impressions across the three months, at a 7% average CTR and an average position of 5.6. The graph shows a strong acceleration from late June onward, followed by substantial growth through July: daily clicks reached roughly 17K, and daily impressions peaked above 150K near the end of the period.

Want a Curve Like This on Your Own Site?

Send us your domain. Within two business days you will get an honest read on where your visibility is being lost, ranked by what it is costing you, and how long a change would realistically take.

Response within two business days. No contracts, no obligation.